
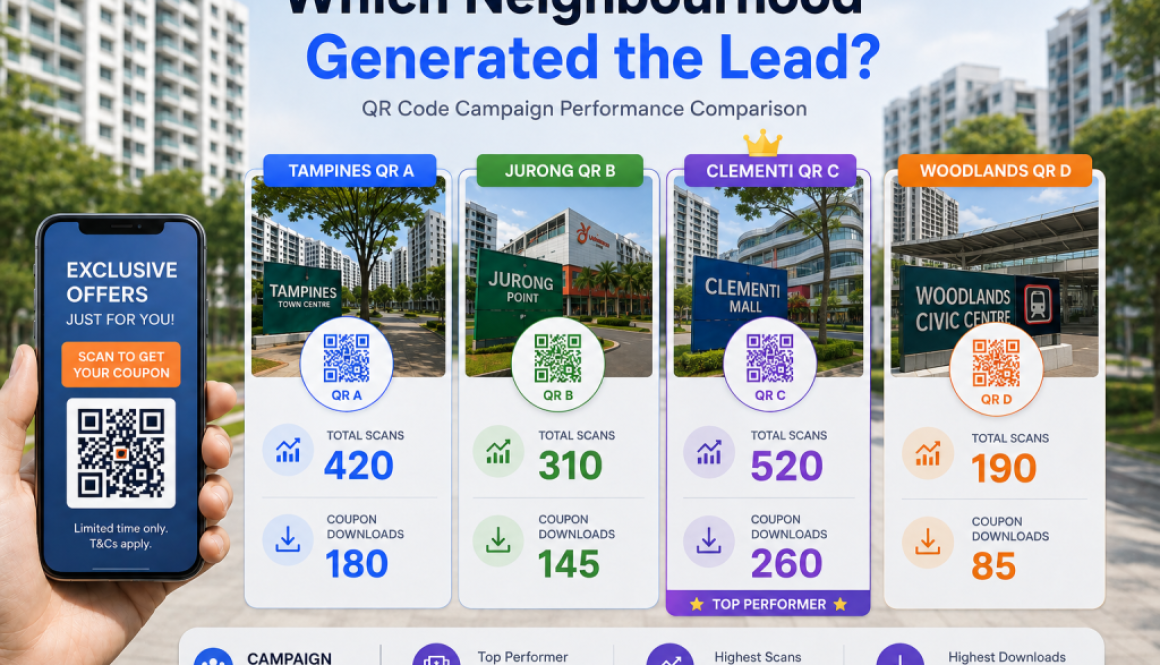
Which Neighbourhood Generated the Lead? Measuring Offline Campaign ROI with Unique QR Codes
Assigning location-specific QR codes to distinct distribution zones allows Singapore SMEs to track offline campaign ROI down to the exact neighborhood, asset type, and promotion variant. By moving beyond simple print volume, this breakdown of offline tracking methodologies reveals how pairing physical flyer drops in areas like Tampines, Jurong, or Clementi with unique QR destinations, FDSG digital flyer landing pages, and UTM parameters transforms unmeasurable print runs into actionable digital data. Measuring performance metrics like zone-by-zone scan counts, offer redemptions, and conversion rates empowers businesses to identify high-performing locations, optimize future budget allocations, and establish clear attribution for every distributed flyer.
Want to know exactly which neighborhood is driving your flyer leads? Comment “QR TRACKING” below and the FDSG team will show you how to connect your next print drop to measurable digital results.
Can You Really Measure Where Your Flyers Worked?
For many Singapore SMEs, flyer distribution starts with a simple goal: reach more potential customers. A business may distribute 5,000 or 10,000 flyers around HDB estates, MRT stations, shopping malls, commercial buildings, or car parks. The campaign finishes, the flyers are marked as distributed, and the business waits for enquiries or sales. The problem comes later when the owner asks a very practical question: “How do I know my flyers were actually distributed, and which area generated the response?”
A distribution report can tell you how many flyers were assigned or delivered. Photos, timestamps, distributor details, location records, and coverage information can provide additional evidence that the campaign was carried out. These records are important because offline marketing happens outside the business owner’s direct view. In Singapore, some distribution providers already use digital reporting tools, photos, timestamps, or progress updates to make distribution easier to monitor.
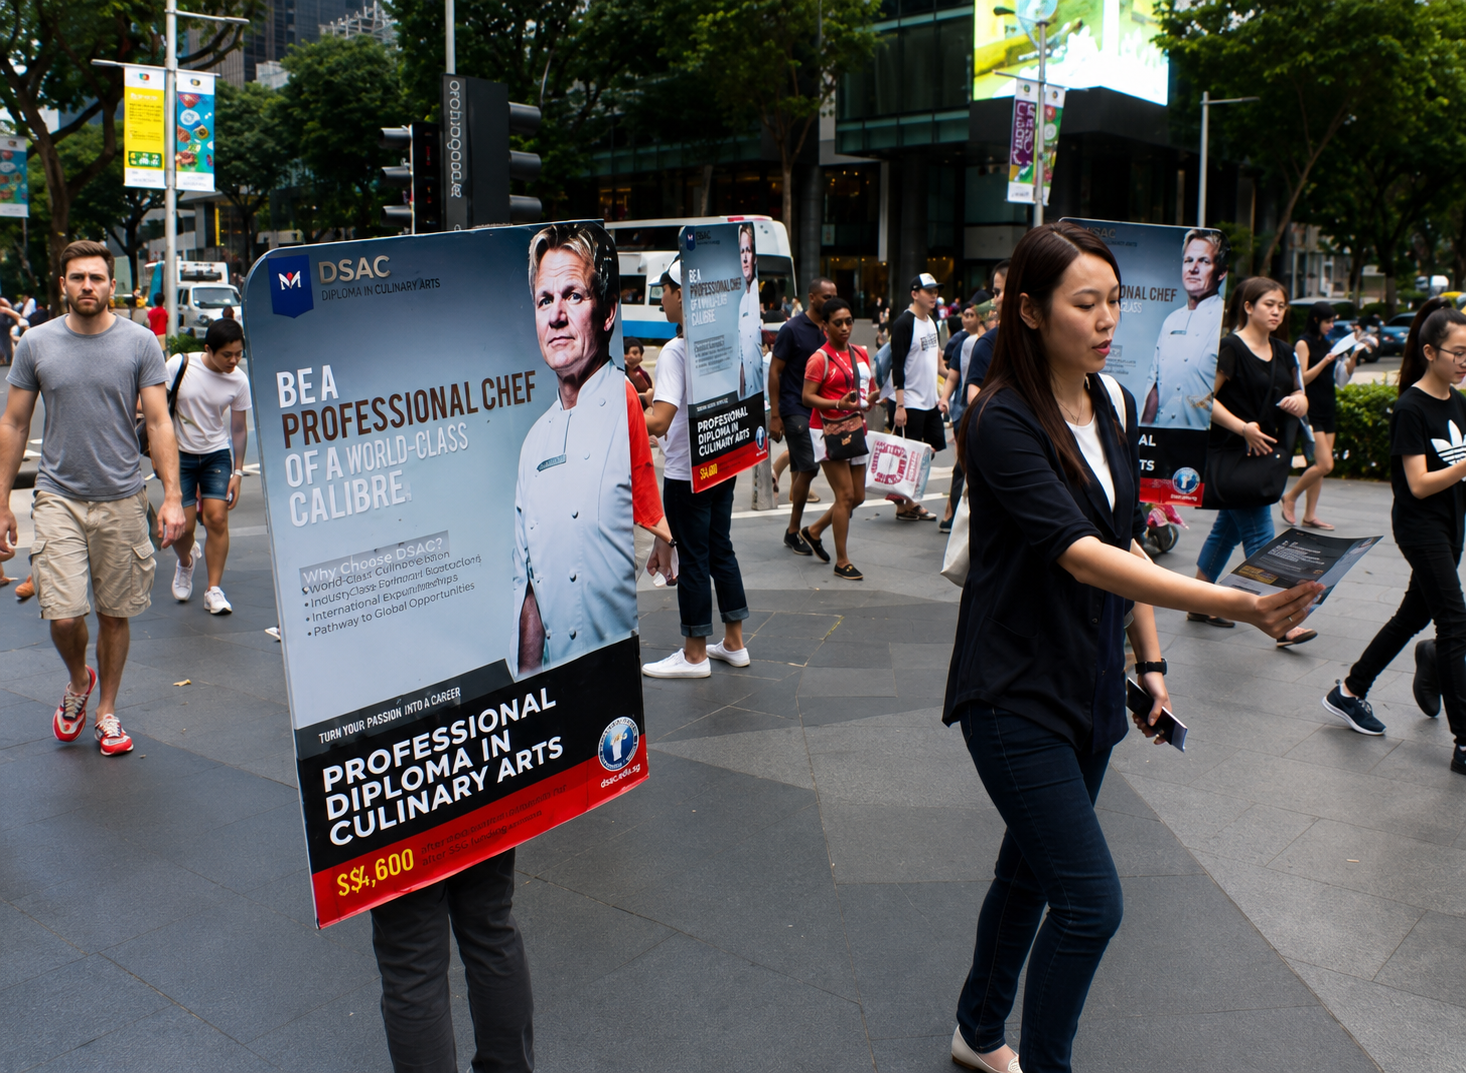
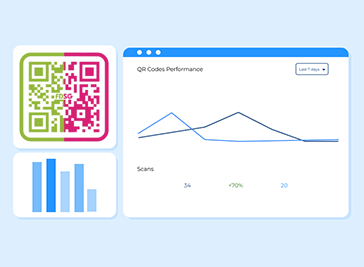
The next question is performance. Suppose your campaign generated 800 QR scans. Is that enough information? A QR code should do more than open a webpage. When different QR codes are assigned to different locations, offers, designs, or campaign channels, businesses can start comparing the response from each part of the campaign. This creates a clearer bridge between offline distribution and measurable digital activity. FDSG supports this approach through unique QR codes, digital flyer landing pages, coupons, engagement features, and campaign tracking.
How to Measure Offline Flyer Campaign ROI with Unique QR Codes
The first step is to treat every part of an offline campaign as something that can be compared. For example, imagine a restaurant distributing flyers in Tampines, Jurong, Clementi, and Woodlands. Instead of giving every flyer exactly the same QR code, each location can have its own QR destination. A scan from Tampines can therefore be identified separately from a scan from Jurong. The business can then compare scans, landing page visits, coupon downloads, enquiries, or other available actions.
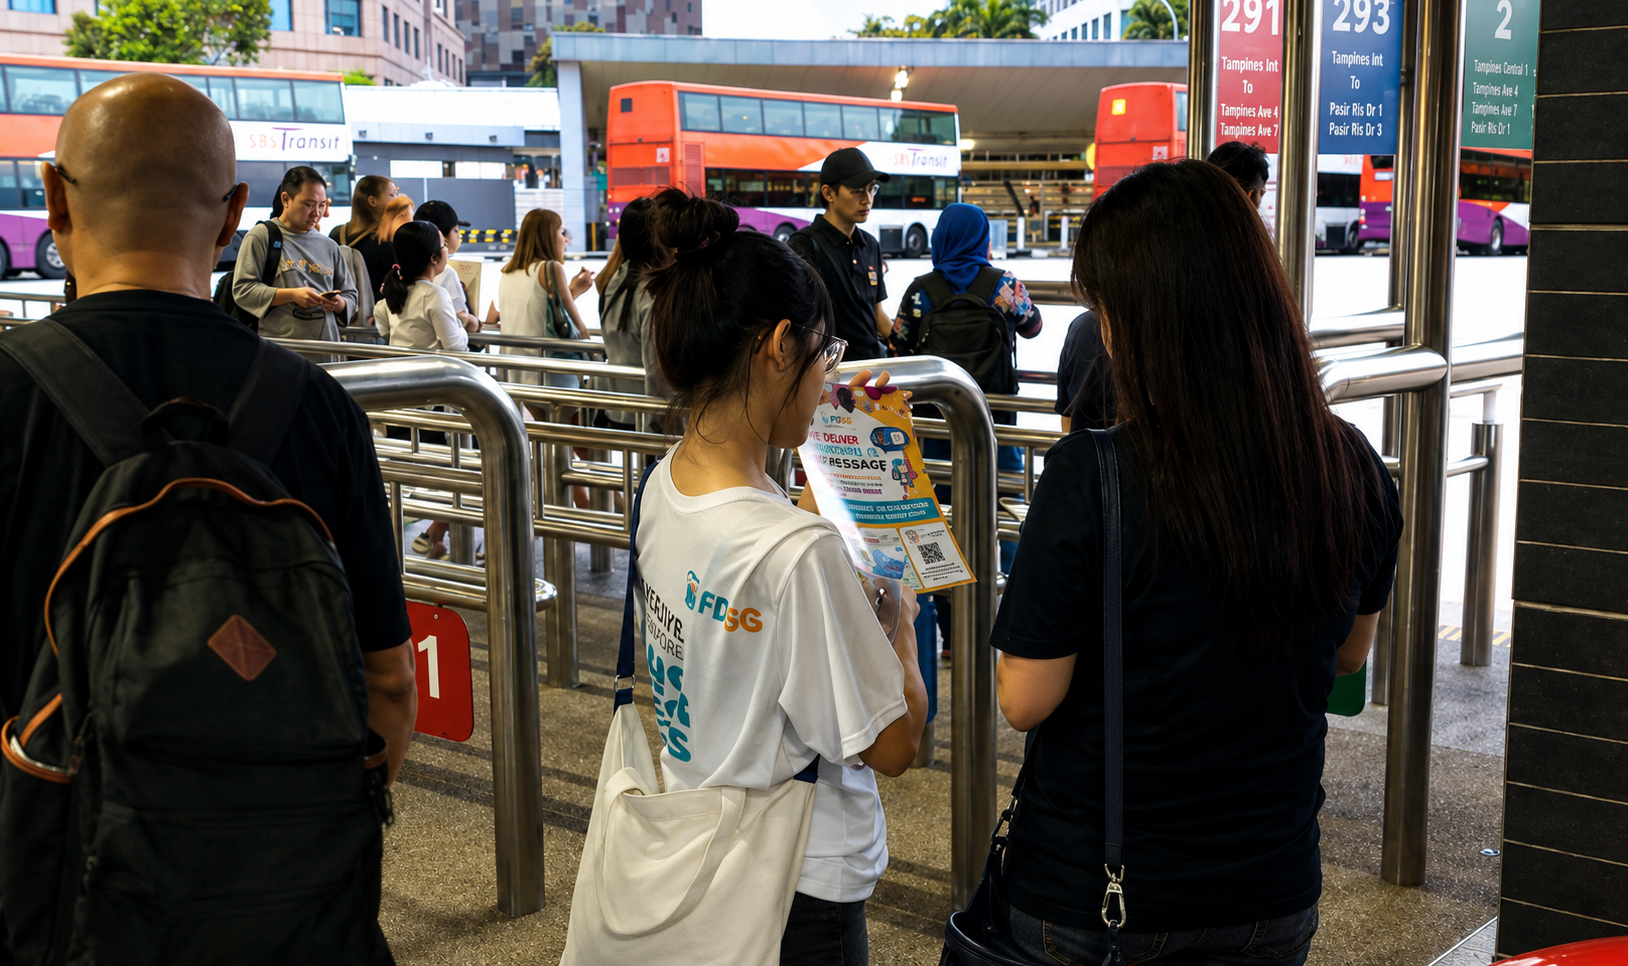
The same method can be applied beyond neighbourhoods. A business could compare:
- Tampines vs Jurong
- HDB vs condo
- MRT vs shopping mall
- Design A vs Design B
- $10 voucher vs 10% discount
- Weekend vs weekday
- Door-to-door vs street distribution
- Event vs commercial area
The important idea is to change one variable at a time where practical. This makes the results easier to interpret. Instead of asking whether the entire campaign worked, the SME can start asking which part worked best.
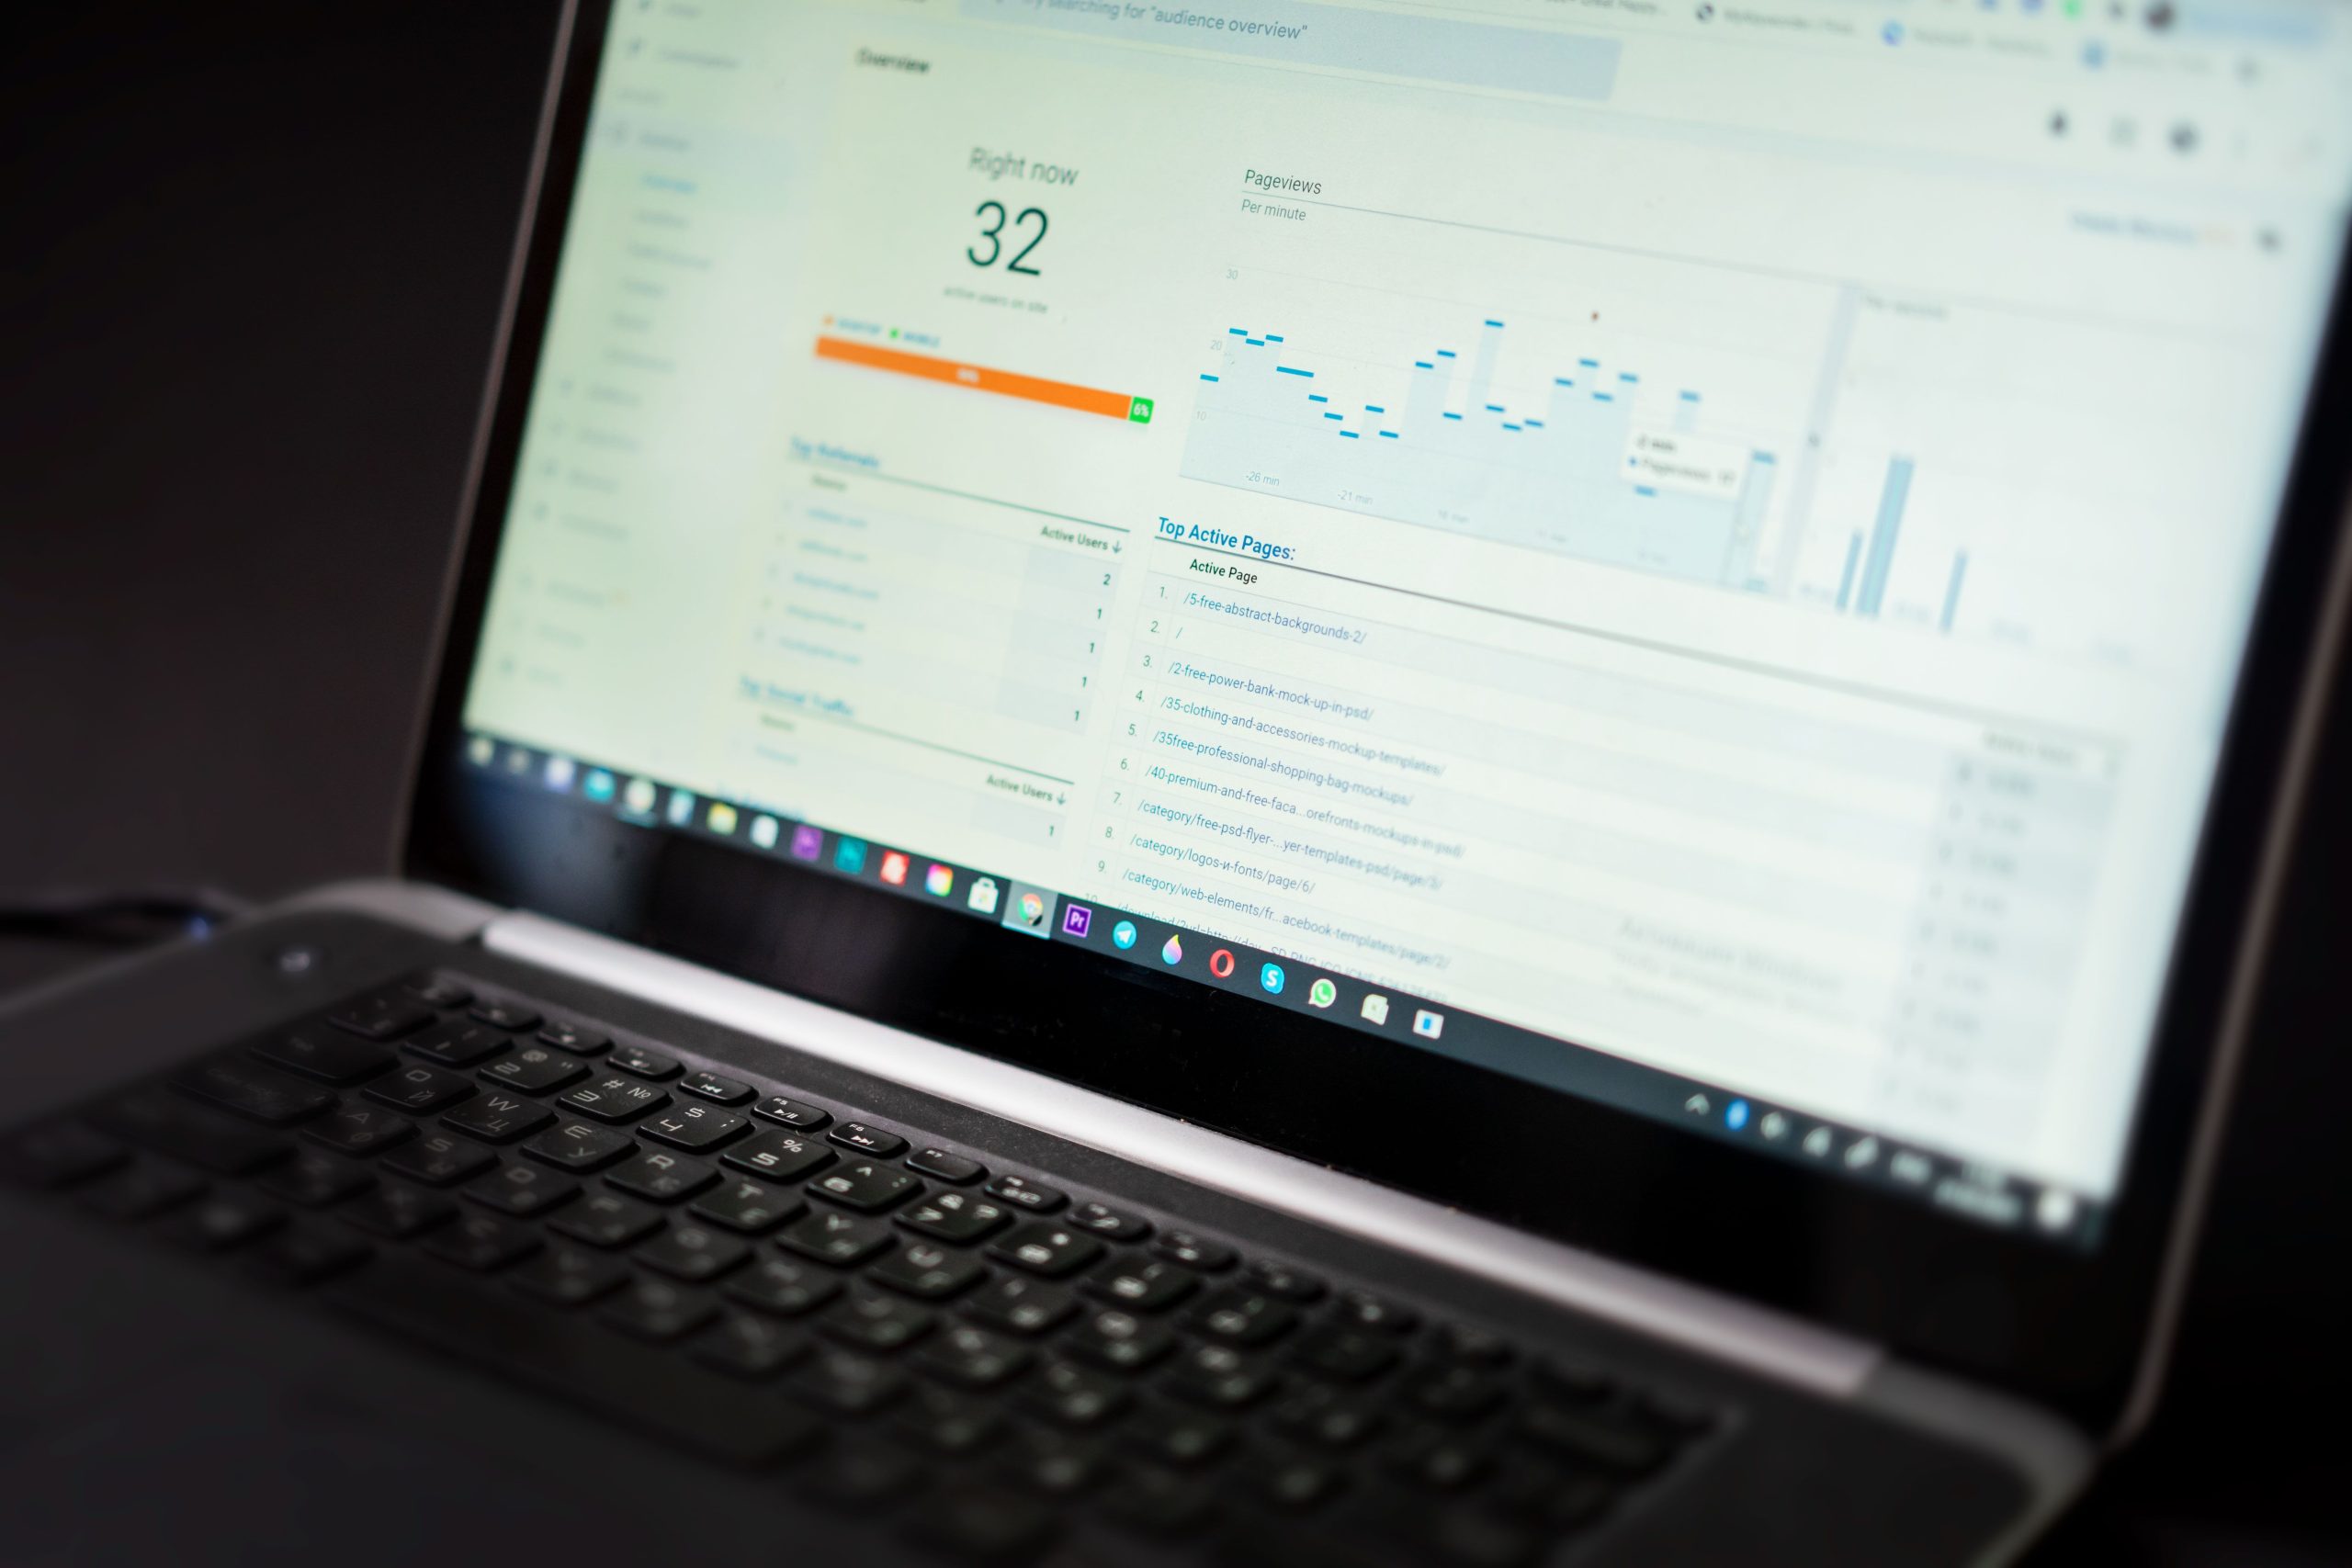
There is also another option for businesses that already have their own website and Google Analytics. Google Analytics supports UTM parameters, which can help identify campaign sources and creative variations in reports:
- utm_source: Identifies where the traffic came from, such as flyers.
- utm_medium: Identifies the marketing channel, such as offline.
- utm_campaign: Identifies the overall campaign.
- utm_content: Identifies a specific location, offer, or creative variation, such as Tampines.
For example, a QR code could send traffic to a URL tagged with utm_source=flyer, utm_medium=offline, and utm_content=tampines. This is useful when the business wants to manage analytics directly. However, SMEs running a focused promotion may prefer a simpler campaign setup.
This is where FDSG can be useful. Instead of asking a business owner to build a separate campaign page, purchase hosting, create tracking structures, and connect several tools before launching, FDSG provides its own digital flyer landing page as part of the campaign ecosystem. The QR code can lead people directly to the FDSG digital flyer, where the promotion, coupon, video, social engagement, or other campaign elements can be presented in one place.
From 10,000 Flyers to Digital Results: WIB and TRIBECAR Case Studies
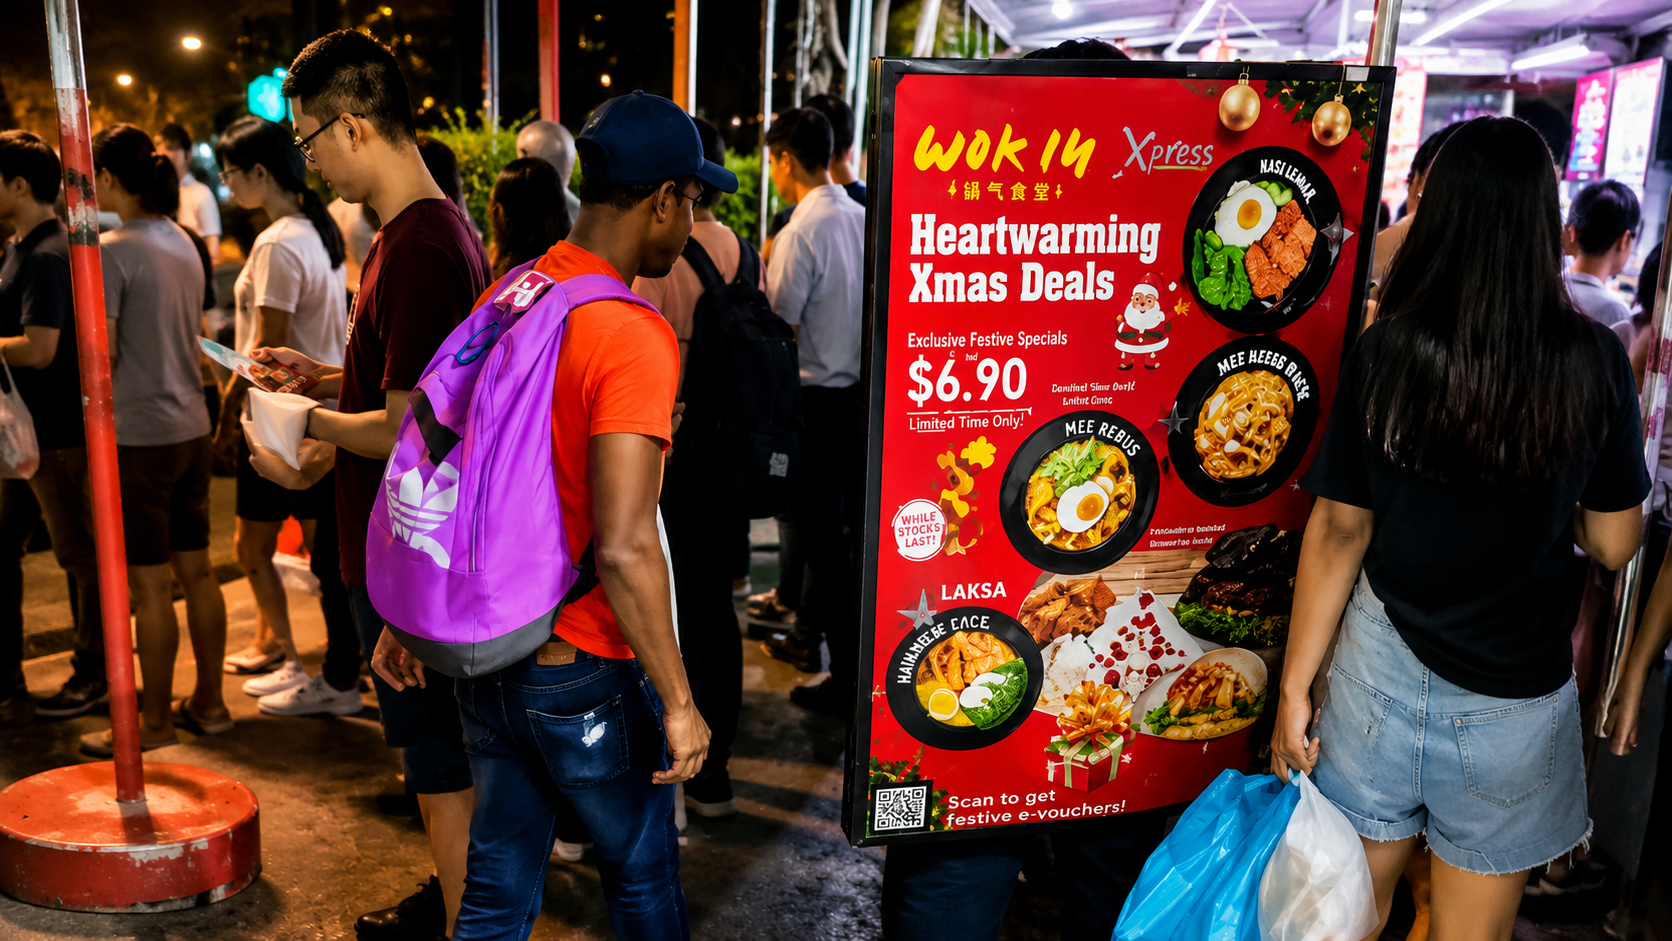
The value of connecting offline and online activity can be seen through FDSG campaign experience. For WOK IN BURGER, an EyeOnMe™ coupon distribution campaign used large, attention-grabbing flyer boards in high-traffic areas. The campaign generated more than 10,000 eyeballs and drove more than 1,000 traffic to the WIB digital coupon landing page through QR scans. The important lesson is the movement from physical attention to digital action. People encountered the promotion offline and were then given a simple way to continue the experience digitally.
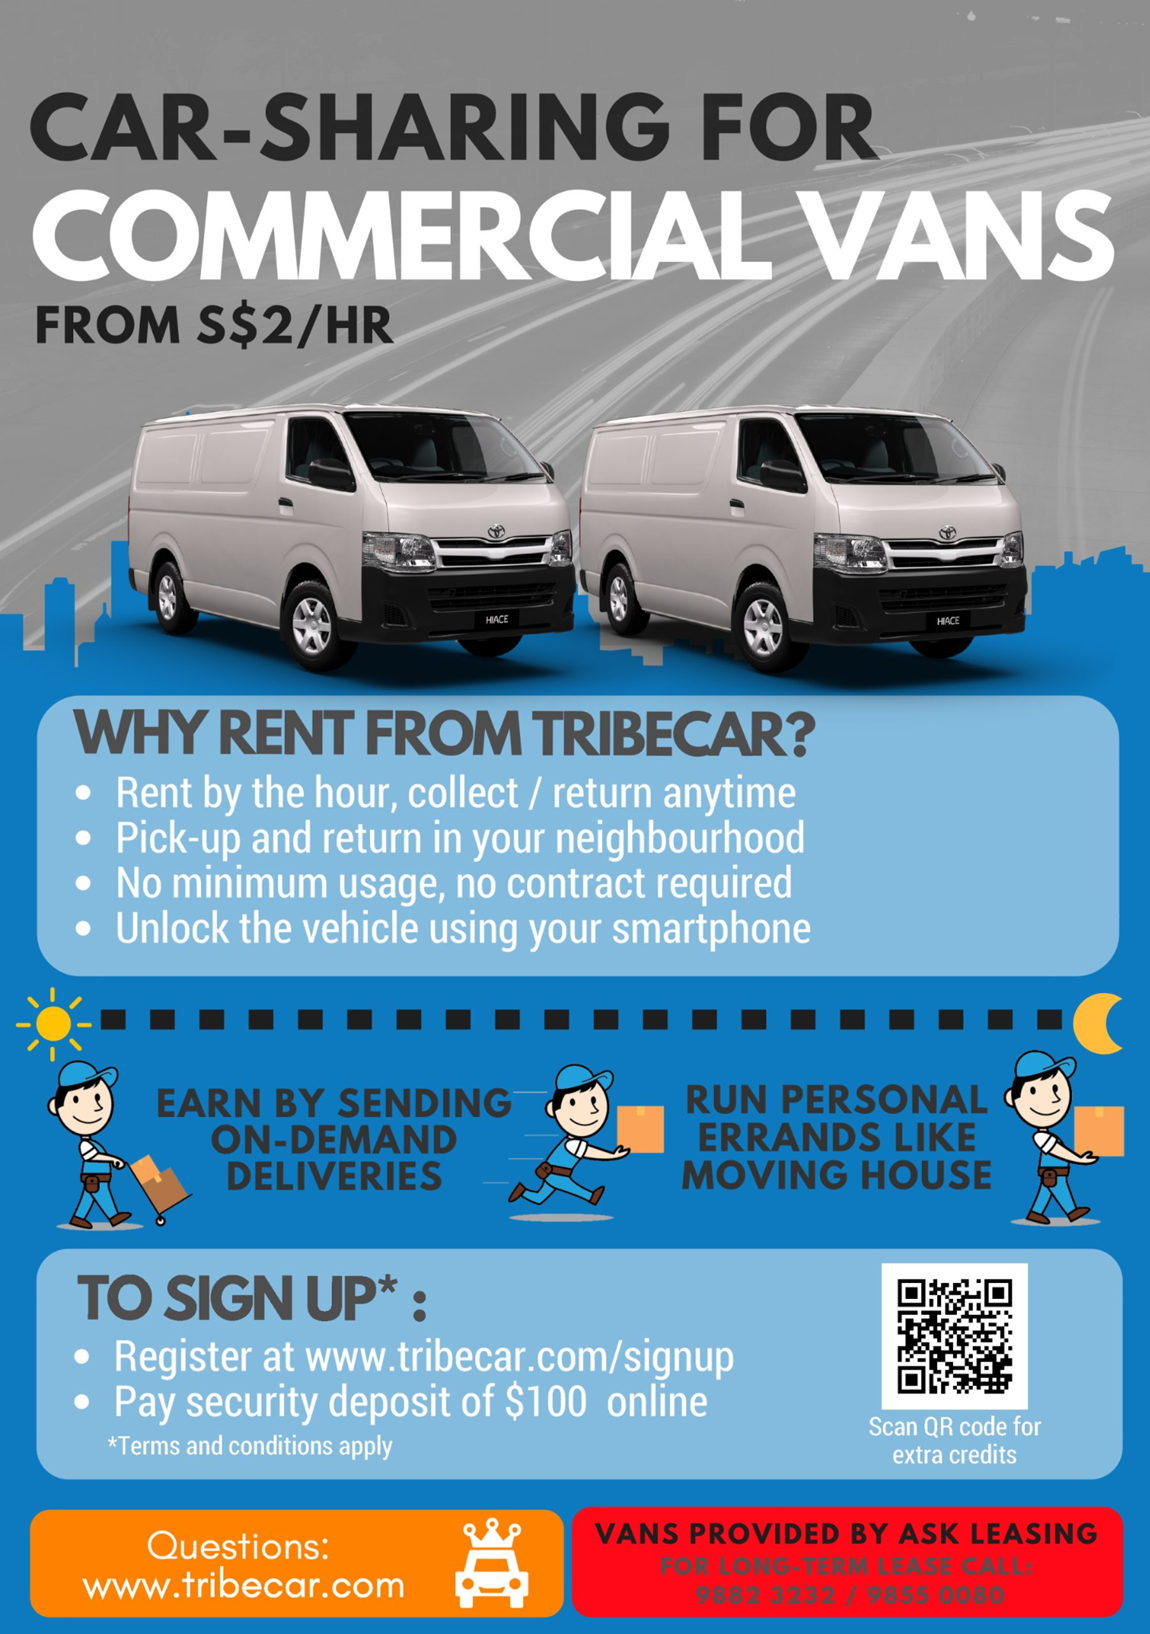
TRIBECAR provides another example. The car rental company distributed 10,000 copies across commercial car parks in multiple locations with QR codes connected to its FDSG digital flyer campaign. The campaign generated 1,220 views on the TRIBECAR flyer page and 685 download deals, despite not using Facebook post adverts. The QR code therefore became the bridge between the physical campaign and the digital offer.
These results also raise an interesting question for future campaigns: What if each distribution location had its own unique QR code? The existing WIB and TRIBECAR results demonstrate the value of moving people from physical promotions into digital campaigns. Location-level QR attribution takes that idea further by helping businesses compare different areas, creative versions, offers, and distribution methods. It gives marketers another layer of information when deciding where to place their next campaign budget.
For example, an SME could compare campaign results like this:
- Tampines QR A: 420 scans and 180 coupon downloads
- Jurong QR B: 310 scans and 145 coupon downloads
- Clementi QR C: 520 scans and 260 coupon downloads
- Woodlands QR D: 190 scans and 85 coupon downloads
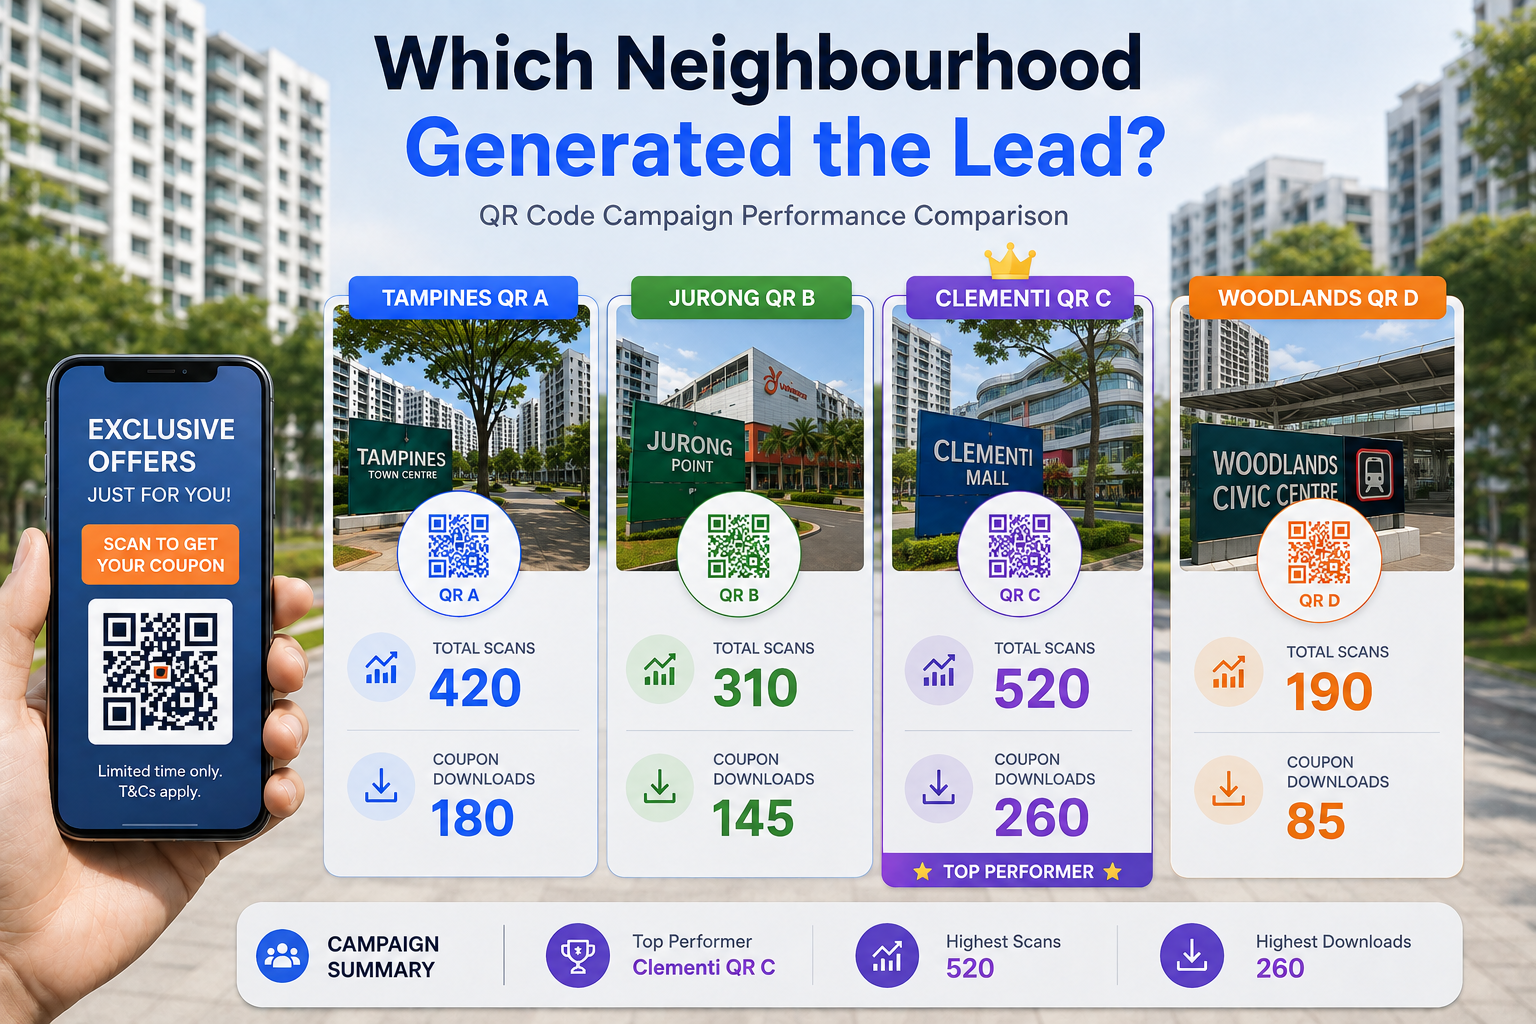
This makes the results easier to understand. Clementi generated the highest number of scans and coupon downloads, while Woodlands generated the lowest. However, businesses should also compare the conversion rate from scans to coupon downloads. Tampines converted about 43% of scans into coupon downloads, Jurong about 47%, Clementi 50%, and Woodlands about 45%. This shows that Clementi performed strongly not only because it generated more scans, but also because a higher proportion of visitors downloaded the coupon.
An SME could therefore discover that one area generated fewer scans but a stronger conversion rate, while another location generated many scans but fewer actions. That difference matters. A campaign should be judged according to the business objective, whether that means enquiries, coupon downloads, registrations, bookings, or sales.
What Should Your Next Offline Campaign Measure?
A successful offline campaign should give an SME more information than the number of flyers printed. Start with the basics: Where were the flyers distributed? How many were distributed? When did the campaign take place? Who handled the distribution? What evidence is available? Then connect the physical campaign to a measurable digital action through a QR code.
The advantage of FDSG is the combination of these campaign elements. The journey can look like this:
- Physical Promotion
- Unique QR Code
- FDSG Digital Flyer
- Landing Page
- Promotion
- Engagement
- Tracking
Many marketing tools are designed to solve one part of this journey. FDSG brings multiple elements together through its digital flyer ecosystem, including unique QR codes, its own landing pages, coupons, lucky draws, social engagement, SMS campaigns, and video engagement.
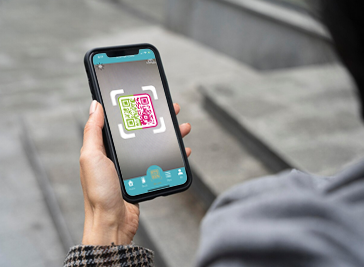
If you are planning a flyer campaign in Singapore, ask yourself one question before printing the first batch: “When the campaign finishes, what will I actually know?” If the answer is only the number of flyers distributed, there may be an opportunity to make the campaign more measurable.
Comment “QR TRACKING” if you want to explore how FDSG can connect your offline promotion to a digital flyer and measurable QR campaign.
Q&A: QR Codes, Flyer Distribution and Offline Campaign Tracking
Can QR codes measure which neighbourhood generated the most leads?
Yes, when different QR codes or tracking destinations are assigned to different locations. For example, Tampines can use one QR code while Jurong uses another. Their scan and campaign activity can then be compared.
Do I need Google Analytics to track QR flyer campaigns?
No. Google Analytics can be useful if you are sending traffic to your own website and want to use UTM parameters. Google confirms that UTM parameters can identify campaign sources, mediums, campaigns, and creative variations in Analytics. However, FDSG provides its own digital flyer landing page, allowing SMEs to run a focused QR campaign without building their tracking journey entirely from scratch.
Can I compare different flyer designs?
Yes. You can create separate QR destinations for different creative versions and compare their results. For example, Design A could use one QR code while Design B uses another. This can help determine which message or visual generates stronger engagement.
Is FDSG only useful for printed flyers?
No. The same thinking can be applied to other offline touchpoints such as posters, event materials, promotional boards, table cards, and other physical campaign assets. The key is connecting each touchpoint to a measurable digital action.
What makes FDSG different from a standalone QR tracking tool?
A standalone QR tool can be useful for tracking scans. FDSG focuses on the broader campaign journey by combining QR codes, digital flyer landing pages, coupons, engagement features, and campaign exposure within one ecosystem.